
Youth
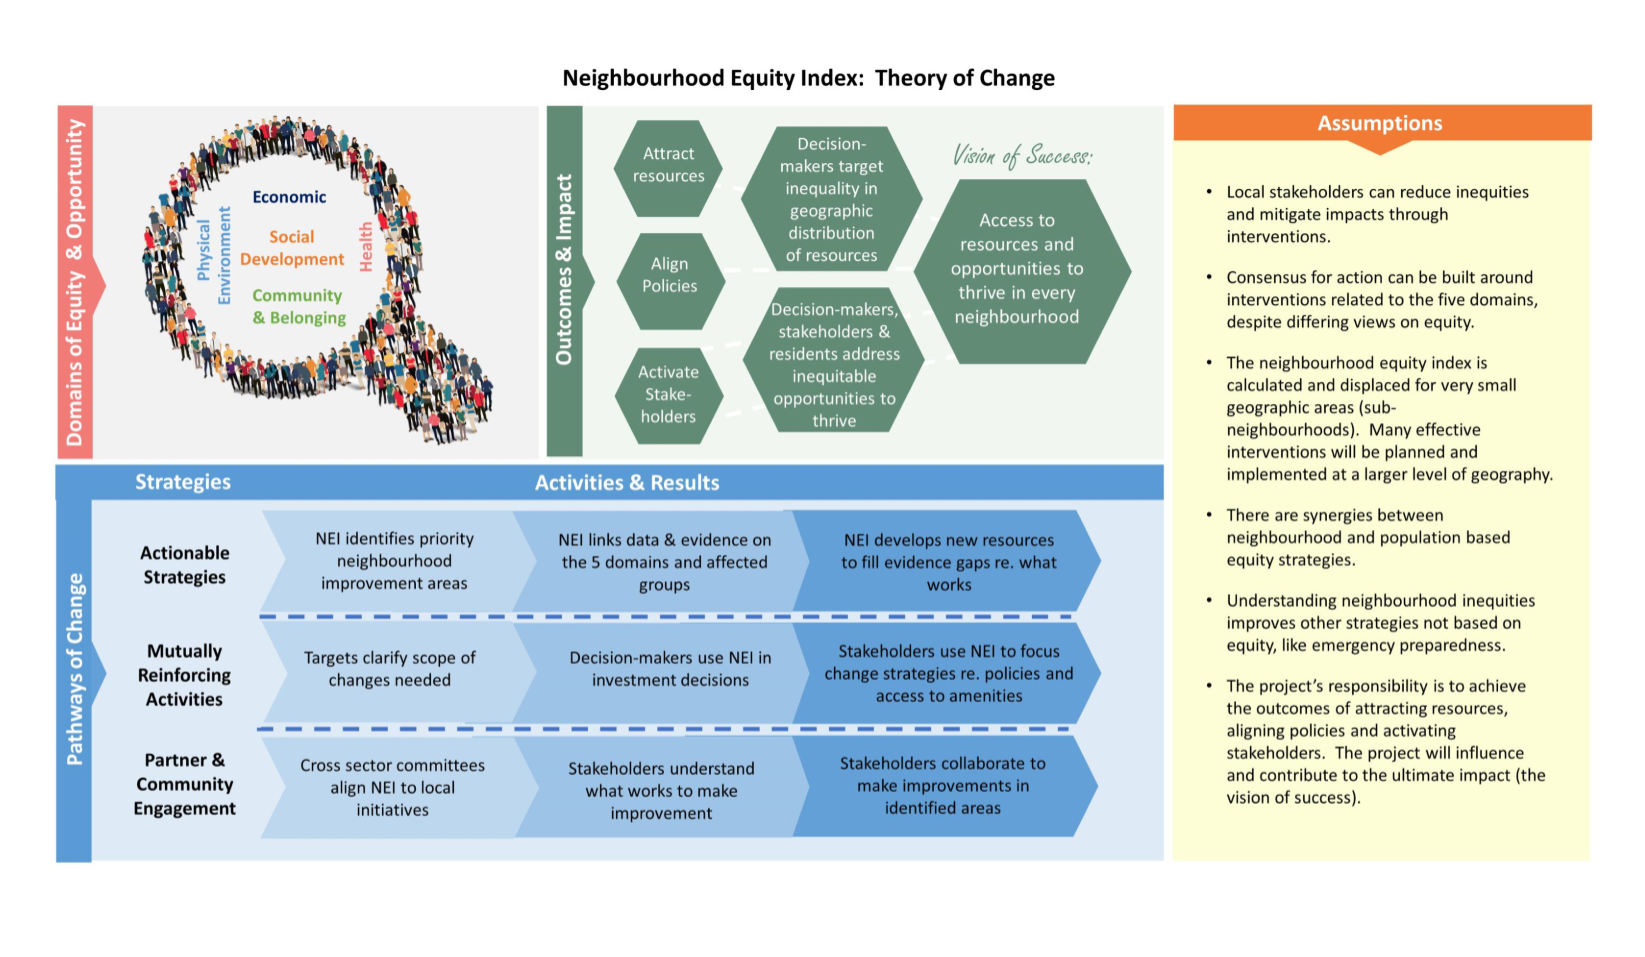
NEI Population GroupsAll youth have the potential to play an extraordinary role in transforming Ottawa cultural, social, and workforce environment. While many youths are successful and actively engaged with community, others face challenges finding their own place in Ottawa society.
The data and maps on this page provide insight into the diversity of youth population across Ottawa neighbourhoods and the challenges they might be facing.
Youth in NEI Neighbourhoods Dashboard
Additional Data & Maps
Youth in NEI Neighbourhoods: Dashboard
The Youth Dashboard presents indicators of youth vulnerability along with statistics on youth diversity in a selected NEI neighbourhood. The two maps allow to compare the percentage of youth in low income or the percentage of racialized youth across Ottawa NEI neighbourhoods.
How to Use the Dashboard
1) Select a Neighbourhood from the interactive list of neighbourhoods located on the left pane. The map will zoom to this neighbourhood and the dashboard indicators around the map will update with the statistics for the selected neighbourhood.
For indicators of low income and unemployment the numbers in green indicate below citywide average population; in red – above citywide average population. of these groups in the neighbourhood.
2) Bring different indicators to view by clicking on the tabs under the indicator and map windows.
Additional details:
- Switch between Map 1 (Low Income Youth, %) and Map 2 (Racialized Youth, %) by clicking on the tabs under the map window. Darker colours signify higher proportions of these groups in the neighbourhood.
- The NEI areas of strong equity concern are outlined in red and numbered with the neighbourhood rank, where 1 is the rank of the most inequitable neighbourhood.
- The layers menu can be opened from the top right corner of the map using the layers icon:
 . It allows to overlay the boundaries of administrative areas (Wards, Community Centres, etc.), or view the distribution of a different measure.
 - Click within a Neighbourhood or open the legend:
 to reveal more information.
How to view by ward, community centre, or neighbourhood
- Select the slide-over panel located on the left hand side of the map.

- Find an administrative area or a neighbourhood from the drop-down lists. When one of these areas is selected the map will zoom and highlight the area.
Note: This selection will not change the statistics of the dashboard indicators and graphs.
Data notes
- The age group of Youth is 15 to 24 years, unless indicated otherwise.
- The Low Income cut off is based on the Low Income Measure After Tax (LIM-AT).
- The data used is based on the 2016 Canadian census of population at a census tract level, accessed via the Ottawa and Region Data Consortium
- Prepared by the Social Planning Council of Ottawa
Additional Data and Maps related to Youth
See more portraits of Population Groups

Families & Children

Immigrants and
racialized groups